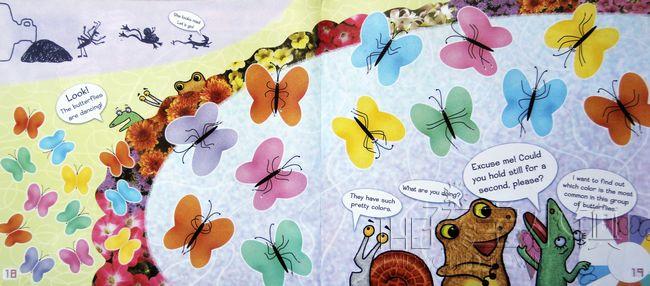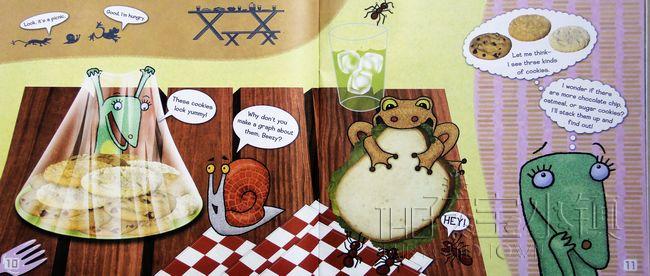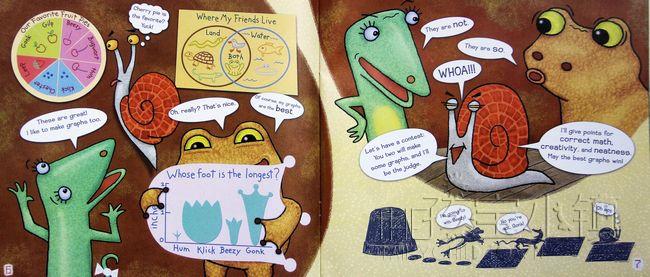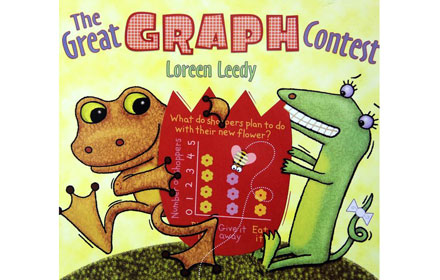
Beezy and Gonk explore all aspects of data management, including data collection (tallies and surveys) and the use of graphic organizers (Venn diagrams, quantity graphs, circle graphs, picture graphs, and bar graphs). In the end, readers will observe from Chester's graphically designed score sheet that the result is a tie. The lively text, delivered in large type and contained in dialogue and thought balloons, is engaging and well supported by the vivid, cartoon illustrations. An occasional photograph creates an interesting, mixed-media effect. While the story itself is informative, true instruction is provided at the end of the book where each graph's data collection and construction is carefully explained, with a page reference provided. An exciting and energetic math resource.